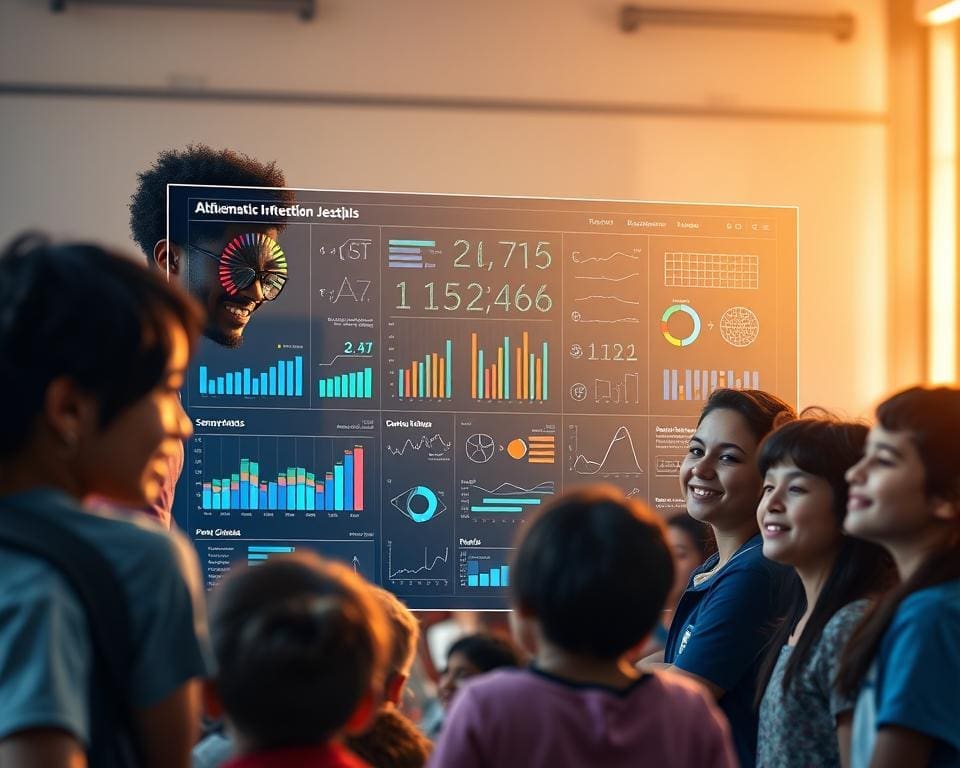
In today’s rapidly evolving educational landscape, the question arises: can data visualisation make maths fun? As we delve deeper into this inquiry, it becomes clear that the integration of data visualisation into mathematics education holds the potential to transform traditional learning paradigms. By utilising engaging visual tools, educators can demystify complex mathematical concepts, making them more accessible and enjoyable for students.
Research indicates that visual representations can significantly enhance comprehension and stimulate interest, allowing students to connect with the subject matter on a deeper level. This exploration sets the stage for an in-depth look at how innovative approaches to data visualisation can enliven the world of mathematics, inviting curiosity and fostering a love for learning.
The Importance of Data Visualisation in Education
Data visualisation in education plays a pivotal role in transforming how students understand mathematical concepts. By incorporating various visual tools into teaching, educators can significantly improve students’ learning experiences and outcomes. The utilisation of visuals assists in conveying complex ideas, making them more accessible and easier to grasp.
Enhancing Comprehension Through Visual Tools
Visual tools such as charts, graphs, and infographics are crucial in enhancing comprehension with visual tools. They provide students with the means to interpret and analyse data efficiently. Research indicates that when information is organised visually, students tend to engage more actively and retain that knowledge longer. This method of presenting information adds clarity to intricate ideas, facilitating deeper understanding and fostering a more robust mathematical foundation.
Engaging Students with Interactive Math Visual Aids
Interactive math visual aids offer a hands-on approach to learning mathematics that captivates students’ attention. Tools like Desmos and GeoGebra allow learners to explore mathematical concepts dynamically, stimulating their curiosity and enthusiasm. These platforms encourage experimentation, promoting a sense of discovery that traditional methods may lack. By integrating these interactive resources, educators can create a vibrant learning environment where students feel empowered to explore and express their understanding.

Can data visualisation make maths fun?
Data visualisation has the remarkable ability to make mathematics engaging and accessible. By transforming abstract concepts into tangible insights, students can grasp complex ideas through interactive and relatable visuals. This approach fosters a deeper understanding and sparks curiosity, making learning an enjoyable experience.
Transforming Abstract Concepts into Tangible Insights
Through effective data visualisation, students can see how mathematical theories apply to real-world scenarios. This process plays a significant role in transforming abstract concepts into clear, understandable formats. When students observe data represented visually, they can identify patterns and relationships that facilitate comprehension. Such visual formats encourage fun maths learning with visual representations, enabling learners to connect theoretical knowledge with real-life applications.
Creating a Playful Learning Environment
A vibrant and playful learning environment enhances the educational experience for students. Incorporating interactive elements such as games and engaging visuals motivates learners to explore mathematics actively. This dynamic atmosphere not only supports enjoyable learning but also encourages collaboration among peers. Educators can create activities that harness creativity and make learning a joyful experience, truly embracing the concept of a playful learning environment.
Understanding Visualisation Techniques for Mathematics
Visualisation techniques for mathematics provide an innovative approach to understanding complex concepts. By incorporating various tools, educators can transform abstract ideas into something tangible and engaging. This section explores common tools and software that aid in the creation of effective visual representations, as well as types of visual aids that are crucial in the learning process.
Common Tools and Software for Data Visualisation
In today’s educational landscape, numerous common tools for data visualisation are available to educators and students. Applications such as Tableau and Microsoft Power BI enable users to create engaging, interactive charts and dashboards. These platforms are not limited to professionals; they are accessible to students as well, making them valuable resources in the mathematics classroom. Other notable tools include Google Charts and Plotly, which facilitate the development of dynamic visualisations that can significantly enhance learning.
Different Types of Visual Representations in Maths
Understanding different types of visual representations in maths is vital for conveying complex information clearly. Visual aids such as bar graphs, pie charts, and scatter plots are instrumental in illustrating various mathematical principles. Each type of representation serves a unique purpose; for example, bar graphs effectively compare quantities, while pie charts can depict proportions of a whole. Scatter plots focus on relationships between variables, providing insights that might remain hidden in text-based data.
Benefits of Visualising Maths for Students
The benefits of visualising maths for students are significant and transformative. By incorporating visual aids into the learning process, pupils experience a profound improvement in their understanding and retention of mathematical concepts. Visual representations not only clarify complex ideas but also make the learning experience more enjoyable and impactful.
Improved Retention and Understanding of Mathematical Concepts
Students who engage with visual tools often demonstrate improved retention of mathematical concepts. Visualising information helps to anchor knowledge in the mind, allowing learners to create stronger connections with the material. Cognitive neuroscience supports this notion, indicating that visuals can stimulate dual coding—where both verbal and visual processing occur—enhancing comprehension.
Increased Engagement and Motivation in Learning
Another remarkable aspect is the increased engagement in learning. When students interact with dynamic visual tools, they are motivated to take an active role in their education. This interaction fosters a sense of ownership over their learning journey, leading to greater enthusiasm and willingness to explore mathematical concepts further. The combination of energy and creativity in a visual learning environment can profoundly transform students’ attitudes towards maths.
Strategies for Implementing Data Visualisation in the Classroom
Embracing effective school data visualisation strategies can significantly enhance the learning experience for students. By integrating visualisation techniques within lesson plans, educators foster a more engaging and comprehensible approach to mathematics. Implementing data visualisation in the classroom transforms traditional teaching methods, making abstract concepts easier to grasp through colourful and interactive tools.
Effective School Data Visualisation Strategies
To create an impactful learning environment, educators can adopt various strategies for data visualisation:
- Utilise software tools that allow students to create graphs and charts, such as Tableau or Google Charts.
- Incorporate visual aids like infographics and videos to illustrate complex concepts.
- Design lessons around real-world data, allowing students to analyse and interpret information relevant to their lives.
- Encourage students to create their visual representations, such as posters or digital presentations, to deepen their understanding.
Collaborative Projects That Foster Teamwork and Creativity
Collaborative projects in education serve as a brilliant avenue for students to embrace data visualisation techniques collectively. By working in teams, students enhance their critical thinking and creativity, resulting in richer educational experiences. Projects can vary from:
- Group activities where students collect data from surveys and present their findings visually.
- Joint explorations of community issues, encouraging students to map their solutions visually.
- Workshops focused on storytelling through data, combining mathematics and art.
Examples of Fun Maths Learning with Visual Representations
Engaging students in mathematics becomes transformative when educators introduce fun maths learning with visual representations. This approach not only demystifies complex concepts but makes the learning process enjoyable and relatable. Let’s explore some inspiring case studies in education where visualisation has played a crucial role in enhancing student understanding and engagement.
Case Studies from Successful Educational Programs
Several educational programmes have effectively integrated visual representations into their curricula. For example, a primary school in London implemented a data visualisation project that used charts and graphs to teach statistics. Students enjoyed creating their own data sets through surveys and represented them visually. This method fostered a deeper comprehension of data interpretation while retaining the excitement of hands-on learning.
Showcasing Real-Life Applications of Visual Mathematics
The connection between classroom learning and the real world is vital. When students see real-life applications of visual mathematics, their interest often peaks. A notable instance includes a workshop at a university where students used visual tools to analyse sports statistics. Participants learned how teams evaluate player performance through data visuals, demonstrating the mathematics behind sports decisions. Such experiences illustrate the practical significance and excitement of mathematical concepts.
Future Trends in Data Visualisation and Maths Education
The landscape of education is constantly evolving, and as we look towards the future trends in data visualisation, the potential for maths education advancements becomes increasingly evident. Emerging technologies such as artificial intelligence and augmented reality are set to transform the way students interact with mathematical concepts, making learning more immersive and intuitive. These innovations offer the possibility of tailoring educational experiences to meet individual learning styles, thereby enhancing comprehension and engagement.
Moreover, the integration of evolving educational technologies into the curriculum encourages educators to remain adaptable. This willingness to embrace change will create a more dynamic learning environment where students can explore and visualize complex mathematical ideas effortlessly. By actively incorporating new tools and practices into their teaching strategies, educators can ensure that students remain motivated and interested in maths, preparing them for future challenges in a technology-driven world.
It is vital for ongoing research and development in the field of data visualisation to continue, as this will maximise its potential in enhancing learning experiences. By fostering a culture of innovation and exploration, we can create a future where data visualisation not only makes maths more accessible but also instils a sense of excitement in learners for the subject. The future of maths education is bright, and it is our responsibility to build pathways that lead to enriched understanding and discovery.


