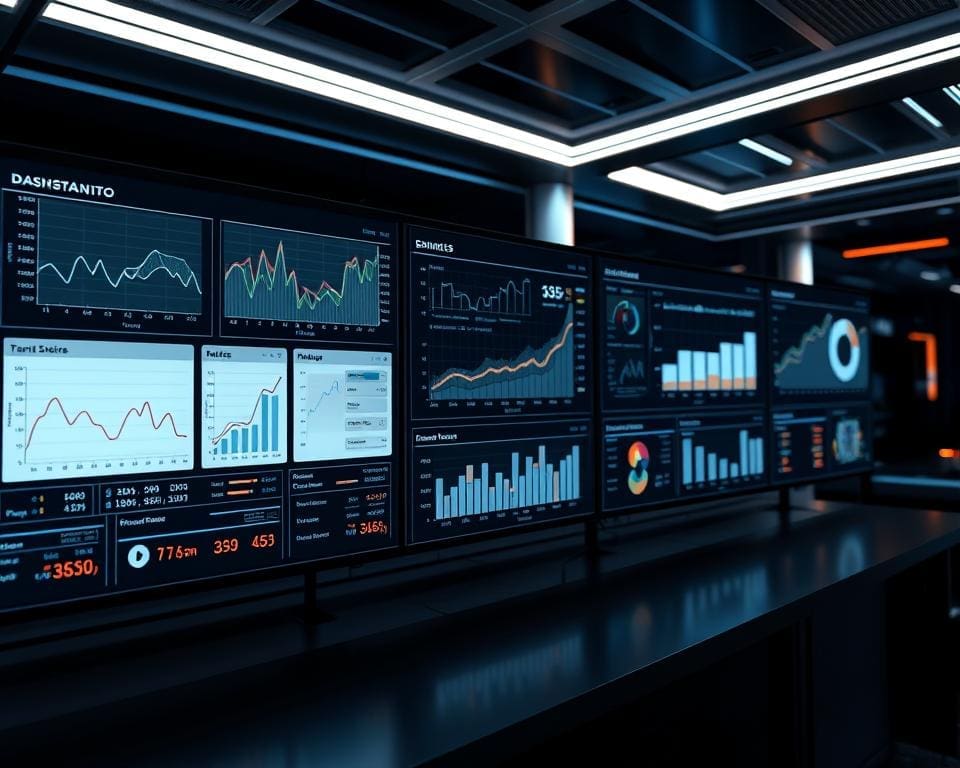
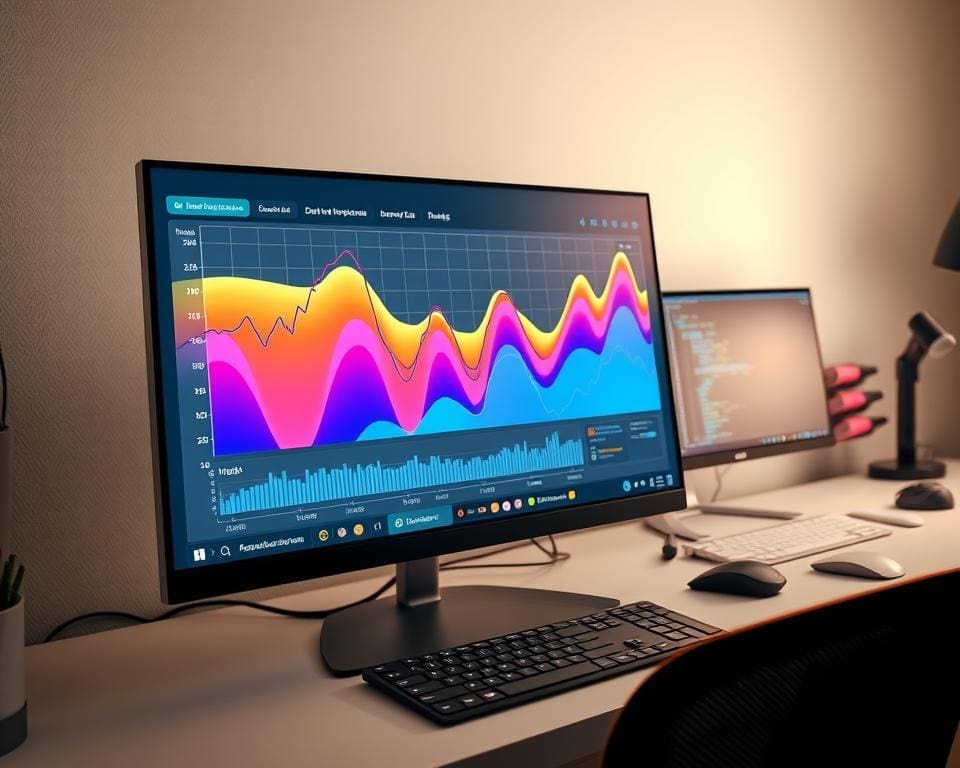
As organisations increasingly shift towards data-driven strategies, the question arises: can you use Python for real-time dashboards? Python has emerged as a powerful tool for real-time data visualisation, allowing businesses to harness live data streams effectively. With the rise of technology, the demand for real-time dashboard tools with Python has surged, providing immediate insights that refine decision-making processes.
Utilising Python for creating real-time dashboards unlocks a world of possibilities for operational efficiency. The capacity to generate rapid, actionable analytics enables organisations to respond to market changes promptly and maintain a competitive edge. Through this article, we will explore how Python can transform analytical frameworks and drive impactful business outcomes.
Understanding Real-time Dashboards
Real-time dashboards provide an exceptional glimpse into live data, allowing users to monitor vital metrics and key performance indicators (KPIs) as they evolve. In sectors like finance, healthcare, and e-commerce, the capacity to receive instantaneous updates on data can significantly steer strategic decisions and operational efficiency.
The functional components of real-time dashboards include data ingestion, processing, and dynamic data visualisation. These elements work in concert, delivering immediate insights that empower organisations to act swiftly and informed. As businesses increasingly rely on data-driven strategies, the importance of effective real-time dashboards continues to gain momentum. Understanding how to harness these tools can lead to enhanced decision-making and improved outcomes.

Benefits of Python for Real-time Data Visualisation
Python has emerged as a powerful tool in the realm of data analysis and visualisation, particularly for creating dashboards that provide real-time insights. The advantages of Python for dashboards are numerous, making it an attractive choice for developers and data scientists alike.
One of the primary benefits of Python real-time data visualisation is its rich ecosystem of libraries, such as Matplotlib, Seaborn, and Plotly. These libraries enable the creation of stunning, informative visualisations that can adapt instantaneously to new data. The ability to integrate seamlessly with various data sources, including APIs and databases, enhances Python’s usability in dynamic environments.
The community surrounding Python is vast and vibrant, offering extensive support and a wealth of resources. This support makes it easier for both novices and experts to troubleshoot challenges and implement innovative solutions quickly. Furthermore, Python’s straightforward syntax promotes readability, ensuring that teams can collaborate effectively without unnecessary complexity.
Incorporating interactivity into dashboards is another significant advantage of Python, allowing users to explore data from multiple angles. Widgets or interactive charts engage users, providing them with a comprehensive understanding of underlying trends and behaviours.
Can you use Python for real-time dashboards?
The growing demand for real-time analytics reflects a significant shift in how businesses operate. Companies increasingly seek ways to glean insights instantly, enhancing customer experiences, driving operational efficiency, and facilitating timely decision-making. This trend has made the need for effective Python dashboard development for real-time analytics more evident. In turn, Python’s capabilities in handling diverse data formats and its seamless integration with real-time data sources position it as a formidable choice for constructing dynamic dashboards.
The Demand for Real-time Analytics
Real-time analytics is becoming essential across various industries. This need arises from the desire to understand complex data quickly and act on it effectively. From financial services monitoring market trends to retail sectors analysing customer behaviours, organisations utilise Python streaming data visualisation to take advantage of constant data influxes. Thus, developing dashboards in Python allows businesses to remain competitive while meeting evolving demands.
Advantages of Using Python
Choosing Python for dashboard development brings several advantages that enhance overall performance. Notably, extensive libraries like NumPy and Pandas simplify data manipulation, enabling developers to create significant insights quickly. Frameworks such as Flask and Django support web application development, making it easier to deploy operational dashboards efficiently. These functionalities not only optimise Python dashboard development for real-time analytics but also empower businesses to deliver insights that were once unattainable.
Popular Python Libraries for Real-time Dashboard Development
In the realm of developing real-time dashboards, certain Python real-time dashboard libraries stand out for their capabilities and ease of use. These libraries empower developers to craft visually appealing and interactive applications with minimal effort, making them essential tools for any data-driven organisation.
Streamlit: Streamlined Dashboard Creation
Streamlit is a prominent choice among Python real-time dashboard libraries, enabling users to build applications swiftly. This library brings the power of rapid prototyping to data scientists, allowing for the creation of stunning dashboards that require little web development experience. With a simple syntax and an intuitive approach, Streamlit transforms complex data into engaging visuals in no time.
Dash: Building Interactive Web Applications
Dash, developed by Plotly, serves as one of the most comprehensive real-time dashboard tools with Python. It thrives on interactivity, enabling developers to create web-based dashboards that offer a high degree of customisation. The ability to integrate complex visualisations and interactive components effortlessly positions Dash as a leading choice for creating data-centric applications.
Implementing Real-time Dashboards in Python
Implementing real-time dashboards in Python requires a systematic approach that enhances data visibility and interactivity. First, establishing a robust connection to various data sources is essential. This might involve fetching data from APIs, databases, or other online platforms. Utilising libraries such as Requests or SQLAlchemy can streamline the process of acquiring and managing data.
Once the data connection is secure, the next step involves effective data processing. This phase focuses on transforming raw data into a format suitable for visualisation. Leveraging Python’s powerful data manipulation libraries, such as Pandas, enables developers to clean and aggregate data efficiently.
Choosing the right visualisation tools is crucial in implementing real-time dashboards in Python. Libraries like Matplotlib, Seaborn, and Plotly provide extensive options for creating interactive and dynamic visual representations of data. These tools allow users to explore insights in real time, fostering better decision-making.
Incorporating best practices during development plays a significant role in ensuring the dashboards’ reliability. Consistency in data handling, along with thorough testing, can significantly enhance the user experience and the overall quality of the analytics produced. Engaging with the Python community through forums and discussions can also offer valuable insights during the implementation process.
Challenges in Developing Real-time Dashboards with Python
Creating robust real-time dashboards with Python involves navigating a series of challenges. As projects scale and data demands grow, developers face obstacles that can impede user experience and system efficiency. Understanding these challenges is vital for successful implementation and maximising the potential of dashboards.
Data Handling and Processing
One of the primary challenges of Python dashboards lies in effectively handling and processing vast amounts of data. High-frequency data inputs can lead to latency issues, making real-time analysis difficult. Ensuring that the dashboard can process data efficiently is crucial to maintaining its responsiveness. Developers must implement robust data pipelines that can manage incoming data streams without sacrificing performance.
Performance Optimisation Strategies
For dashboards to function seamlessly, performance optimisation in Python is essential. Adopting strategies such as caching mechanisms can significantly reduce load times by storing frequently accessed data. Additionally, employing data aggregation techniques helps in minimising the volume of data that needs to be processed in real-time. Efficient coding practices should not be overlooked, as they contribute significantly to the overall performance of the application.
Case Studies of Python Real-time Dashboard Applications
The implementation of Python in creating real-time dashboards has dramatically transformed various industries. Through effective case studies, we can observe the innovative ways businesses harness Python for immediate data visualisation, catering specifically to the financial and healthcare sectors.
Real-time Finance Dashboard
In the finance industry, real-time dashboards created with Python facilitate rapid analysis of stock market trends. These dashboards track market shifts and provide insights into investment performance. With the integration of live data feeds, financial analysts can assess risk assessments instantaneously, enabling informed decision-making. The flexibility of Python libraries allows for custom visualisations, ensuring that stakeholders receive the precise information they need at the right moment.
Health Monitoring Systems
Health monitoring systems illustrate another compelling application of Python for real-time dashboards. In hospitals, clinicians utilise Python-based dashboards to monitor patient vitals, showcasing data that appreciates in value with real-time updates. This capability leads to timely interventions and improved patient outcomes. The ability to visualise essential medical data helps healthcare providers respond effectively to changing conditions, showcasing Python’s versatility in critical environments.
Future Trends in Real-time Visualisation with Python
As technology continuously progresses, the realm of real-time data visualisation is experiencing transformative changes. One of the most significant future trends in Python dashboard development is the increasing integration of machine learning for predictive analytics. By incorporating sophisticated algorithms, developers can create dashboards that not only display data in real-time but also offer insights into future trends and behaviours, enabling businesses and individuals to make informed decisions swiftly.
Additionally, the rise of serverless architecture stands out as a crucial development for enhancing scalability and reducing overhead costs. This approach allows developers to focus on building interactive dashboards without worrying about the underlying infrastructure, significantly streamlining the Python dashboard development process. Consequently, organisations can efficiently manage varying data loads while ensuring seamless user experiences.
Finally, as businesses prioritise user experience in dashboard design, there is a heightened focus on intuitive interfaces and aesthetically pleasing visual presentations. The future trends in Python dashboard development reflect an ongoing commitment to not just delivering information but doing so in a way that engages users. With Python’s strong community and diverse libraries, its role in the evolution of real-time visualisation is set to expand, paving the way for more intelligent, interactive dashboards that reshape how we view and interact with data.


